Your brand is getting off to a great start. But how do you know? Are your sales increasing? Are you gaining more traffic on your website?
You can search these answers by analytical reporting.
This might sound frightening to some of you – analyzing data, creating reports, and understanding complex analytical terms.
Not to worry! This blog will break down how to analyze your business, what to look for, and what analytical tools you should use.
What elements to add in an Analytical Report

Successful brands conduct marketing analysis before they introduce a new good or service to their intended audience. Conducting research typically involves reviewing industry analyst information, getting expert opinions and contacting customers for their feedback.
Here are some elements for you to look into when analyzing your business.
- Identify the problems your product or service can solve – Spread out the details and features. Compare and contrast your good or service with competitors. Analyze the strengths and weaknesses.
- List detailed info about your customers – List the age, gender, location, and interests of your customer. Describe how you plan to market your product to them in the current economic environment.
- Run focus groups or conduct surveys – This will help you learn what your customers are saying about your brand. Their input can determine which step you need to take to continue to grow your business.
- Estimate the size of the target market – Determine what customers might be willing to pay for your product or service. List features that differentiate your products or services from your competitor’s products or services. Identify current customer requirements and project future needs.
- Establish a measurable marketing goal – Set measurable goals, such as increasing sales to new customers by 2% within the next six months. Describe how you will track and monitor your progress.
- Keyword Data – Keywords can reveal exactly what features or solutions your customers are looking for. By examining keyword frequency data you can infer the relative priorities of competing interests. Keyword frequencies can identify and predict trends in customer behavior.Understand where customers are struggling the most and how support resources should be deployed.
Source – Duggan, T. (n.d.) How to Write a Marketing Analysis Report. Retrieved from https://smallbusiness.chron.com/write-marketing-analysis-report-3452.html
Analytical Lingo
Analytical terms can be complex. Here are some terms for you to know when analyzing your reports.
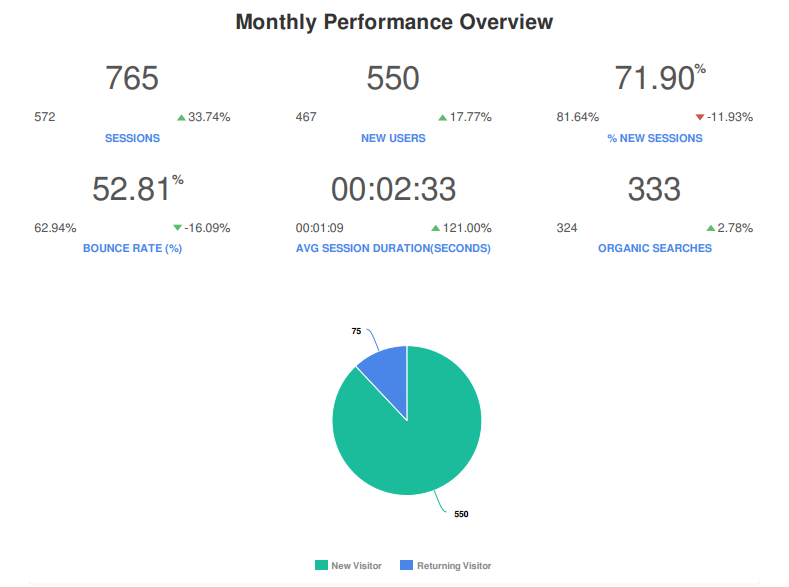
- Sessions – The number of times your website was viewed during the month.
- Users – How many people viewed your website during that month. This number will always be lower than your sessions as some people might view your website multiple times in one month.
- Bounce Rate – % in which people came to your website and left.
- Page Views – This is the number of pages viewed during the month.
- % of New Sessions – These are the brand new clients who have never clicked on your website before and finding you in a search.
- Avg time on a page – The amount of time the average person spent on your page.
- Page views/session – The average number of page views during the time someone was on your website.
Why You Should View Your Analytics

Analytical reporting might be monotonous and tedious. Nonetheless, knowing how your consumers are coming to your business determines what your next move is in terms of your marketing campaigns. Here are 4 important tips for you to consider.
- Analyze your Audience/Traffic Data – This is your one-stop-shop for traffic data and the first piece of data that loads upon arrival within Google Analytics. From Organic to Paid this is where you can discover all the important bits of information that tell you how many users come to your site, who they are, what they do, and everything in between.
- Engagement Stats – Not only do you want to see how many people are visiting your website, but you want to see what they are doing once they get there. Is there a high bounce rate? Are users spending an “x” amount of time on your website? Are they viewing more than one page?
- Aquisition – Acquisition data can tell you everything– from which landing pages are drawing in users to what content on your site is performing the best. This is the more specific data that helps you improve and optimize your site to provide better user experience.Knowing how many users come to the site is great, but knowing how they got there and what they do after they’re there is even better.
- Goals and Conversions – The fundamental premise of any business, online or otherwise, is to provide customers with products or services. What is the ultimate purpose of your website? Do you want people to fill out a form? Do you want people to purchase a product? Creating these goals into conversations is a process. You should set up the goals specific to your business and measure them throughout time.
Source – Alsayegh, A. (2015, May 21). 5 Things Business Owners Should look for in Google Analytics. Retrieved from https://www.v9seo.com/blog/2015/05/21/5-things-business-owners-should-look-for-google-analytics/
Analytical Tools For You!

Now that we have identified elements in your analytical report, we will take a look at some software that you can utilize to measure your marketing campaigns.
- Google Analytics – This feature is a free web analytical service offered by Google. This tracks traffic on your website, how much revenue you made with your goods and services, where your traffic came from, and more! Google also offers free courses for you to learn. Click here to start today!
- Social Media Analytics – Did you know that Facebook, Twitter, and Instagram have analytical tools? These built-in tools within your brand’s page help you understand how much your marketing campaigns are paying off.
- Bitly – Bitly is best known as a free link shortener and its features do more than just save space. Once you’ve shortened links—and possibly even added a vanity URL shortener—Bitly gives you the tools to efficiently share those links and analyze their performances.
- Piwik – Piwik’s free software comes with a caveat: You’re required to download the program and host it on your own server. Piwik offers similar features to other popular analytics programs, including event tracking, visitor maps, and keyword search, but what sets it apart from its competitors is its mobile app and unlimited data storage.
- Open Web Analytics – Open Web Analytics (OWA) is an open-source software, just like Piwik. Similarly, there is no limit on the amount of data you can store or the number of websites you can measure through the program.
Don’t have the time to analyze your data? Not to worry! We, at Pearl Marketing & Design, have experts to analyze and interpret your data.